Use PhiMatrix as a tool to analyze and predict stock markets or foreign currency exchanges.
Timing and price movements in financial markets have long been associated with the Fibonacci sequence, which is used in technical analysis of the markets. Fibonacci number relationships, however, are only approximations of the true golden ratio, or phi, relationship of 1.618… produced by PhiMatrix.
Application of PhiMatrix to Stock Charts
Click and drag the PhiMatrix application to resize it so that the corners of the grid align with major high or lows in the market.
Adjust the number of vertical grid lines to seek key timing points in the market. Set V Axis to Both to add timing lines on both sides of the midpoint.
Adjust the number of horizontal grid lines (H Lines) to seek key price levels in the market. Set H Axis to Both to add price resistance point lines on both sides of the midpoint.
A Market Price and Timing grid below is available from the View menu.
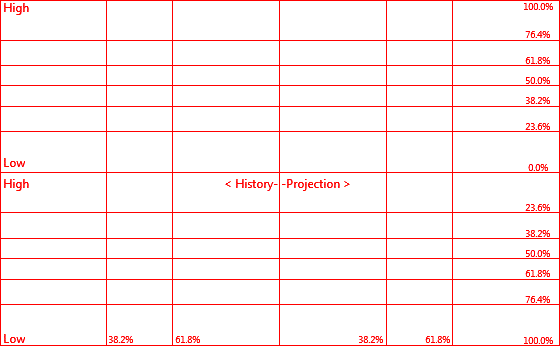
This grid can be helpful to illustrate basic principles of key timing and price resistance lines. There are a variety of other grids which may be equally useful, and that can be customized to your needs. These are also available from the View menu (e.g., basic phi grid, Fibonacci grid, golden spiral, etc.) and can be customized by the user to meet individual needs and analysis methodologies.
It’s easier, of course, to apply the grids to historical trends than it is to use them to predict future movements. As an example, the timing of a movement may seem clear, but the direction in price may not be as clear. Experienced traders know that application of Fibonacci and Golden Ratio techniques should be considered as one of a number of tools in knowing the securities being traded and predicting their future movements. The grids are a great tool that properly applied can improve the probabilities for a successful trades.
Examples of application of these techniques are below.
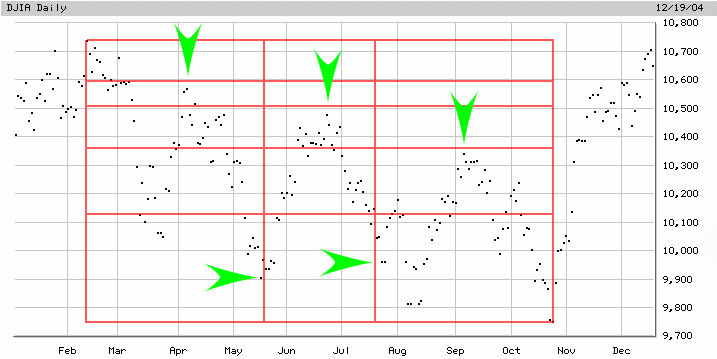
Dow Jones Industrial Average, January 2004 through November 2004
Note how two key pricing lows coincide with the two primary vertical phi lines.
Note too that the three interim highs achieved between January 2004 and November 2004 coincide with the horizontal phi lines.
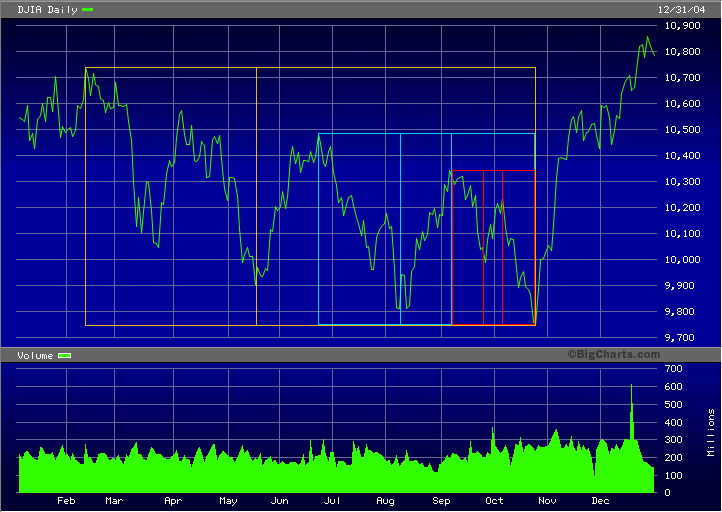
Here’s another view of the 2004 Dow Jones Industrial Average that shows five golden ratios in the timing of highs and lows, as shown by the gold, aqua and red golden ratio grids starting at the high in February and ending with the low in October:
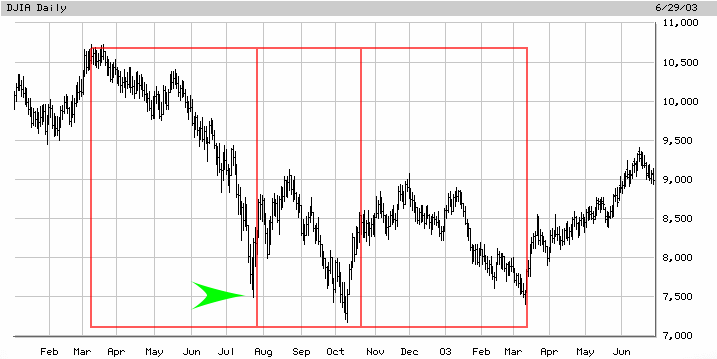
Dow Jones Industrial Average, January 2002 through June 2003
Note how the first major low in prices coincides with the vertical phi line.
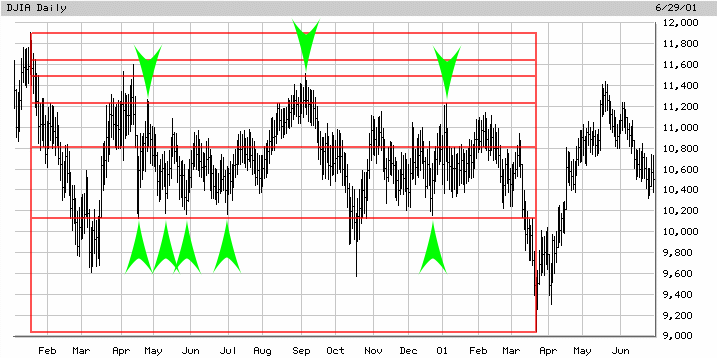
Dow Jones Industrial Average, January 2000 through June 2001
Note how the highs and lows in pricing through this period match up with the horizontal phi lines, showing resistance points in market pricing.
Once you have identified key price and timing points, use the grid to project potential price levels and timing points for future periods.
Learn more about application of Fibonacci principles to the markets at GoldenNumber or Elliott Wave International or Carlos Wolf’s FXTecTips.
Legal notice: No express or implied warranties of given in the use of this tool. The user assumes all risk for results of decisions made. It is highly recommended that the advice of a qualified investment advisor be obtained in making investment decisions and that other analytics and tools are used in making any investment or trading decisions.
Simply awesome. I am very interested in this Science after discovering Dr. Flanagan, which led me to this site. My Family is very Talented, yet we are in dire straits financially. I am curious- could it be that we are somehow “out of sequence”? Thanks. gloria
The first rule of investing is to not put money at risk that you cannot afford to lose. Use multiple analytic tools for investment decisions, of which Phi and Fibonacci are just one. Best of success to you.